
This document explains the usage of the reimplemented ASKALON visualization diagrams. The current implementation consists of two different but completely consistent implementations of the different diagram types, one using Java3D to render the diagrams, the other using an own implementation of a renderer.
The Java3d implementation:
The Java3d implementation uses the famous implementation of 3d graphics for the java programming language. This
library renders the diagrams using the hardware capabilities of the machine it is running on, in the ideal case this is some kind
of graphics accelerator, in the worst case an implementation of a software renderer like Mesa.
This might result in a very smooth and efficient drawing of the diagrams, if the graphics accelerator does a good job. The performance
of this implementation is directly dependent on the power of the graphics accelerator. This implementation only runs on platforms
supported by Java3d.
Important note for the Java3d implementation:
| The Java3d Canvas is a heavyweight component which works fine so far in a leightweight environment like Swing. But there are problems with JPopupMenu's or JComboBoxes. Therefore a program using the Java3d diagrams has to call JPopupMenu.setDefaultLightWeightPopupEnabled(false);before creating any JPopupMenu's or JComboBoxes. |
The Java2d implementation:
The Java2d implementation uses its own very specialized renderer which draws the diagrams using the capabilities of java2d,
Java's own graphics mechanism. This implementation does a very good job on machines without a graphics accelerator but with
a fast CPU, also this implementation always works, it does not depend on any external libraries like the Java3d version, so it
just works everywhere and therefor is the default fallback.
To use the java2d version it is already enough to put gridvis.jar into the classpath. To use the Java3d implementation also the libraries of Java3d, j3dcore.jar, j3dutils.jar and vecmath.jar have to be in the classpath. Additionally on most systems (besides MacOSX or systems where Java3d is already installed) the native libraries have to be accessible via the system property java.library.path or the system dependent library paths (like LD_LIBRARY_PATH on *nix). Both types of libraries are part of the askalon libraries.
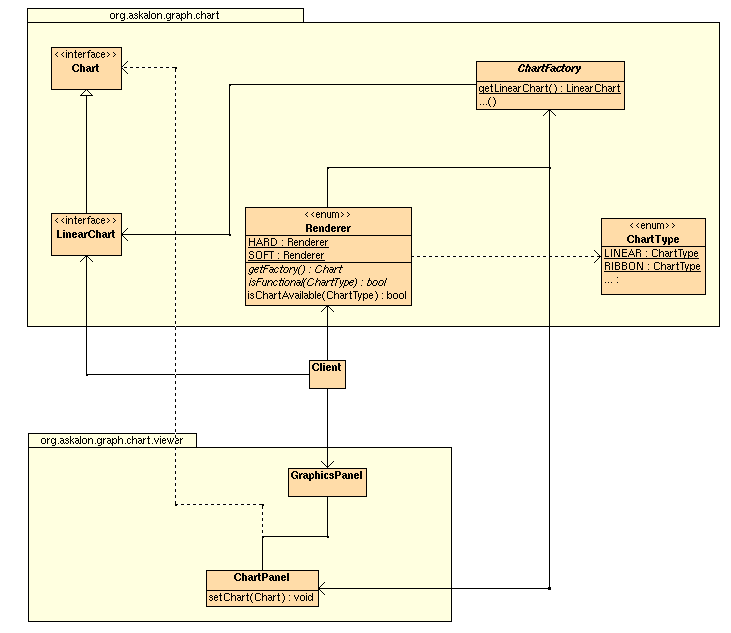
To use the diagrams in an application only a few basic steps are needed:
1 import org.askalon.graph.chart.ChartFactory; 2 import org.askalon.graph.chart.ChartType; 3 import org.askalon.graph.chart.LinearChart; 4 import org.askalon.graph.chart.Renderer; 5 import org.askalon.graph.chart.viewer.ChartPanel; 6 import org.askalon.graph.chart.viewer.GraphicsPanel; 7 8 public class Example { 9 public Example() { 10 Renderer r = Renderer.HARD; 11 if (!r.isFunctional()) 12 r = Renderer.SOFT; 13 14 ChartFactory cf = r.getFactory(); 15 ChartPanel cp = cf.getChartPanel(); 16 GraphicsPanel gp = new GraphicsPanel(cp); 17 18 // Create the chart etc. 19 } 20 } |
1 if (r.isChartAvailable(ChartType.LINEAR)) { 2 LinearChart lc = cf.getLinearChart(5, 3); 3 cp.setChart(lc); 4 5 // Do whatever comes next for your application 6 } |
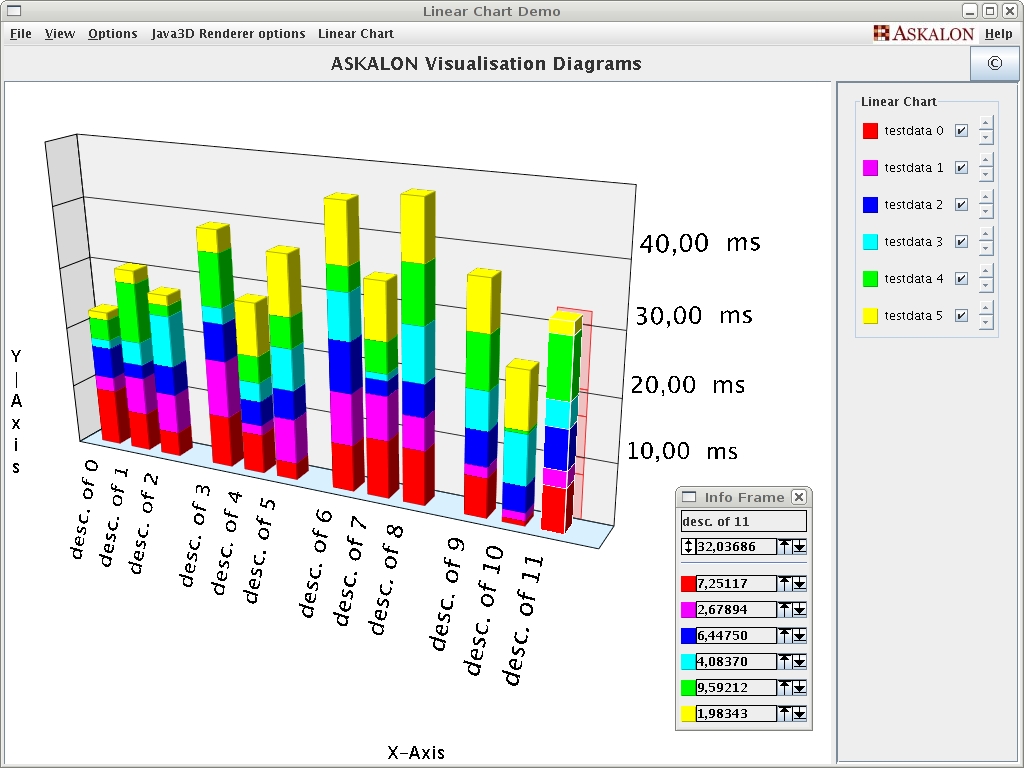
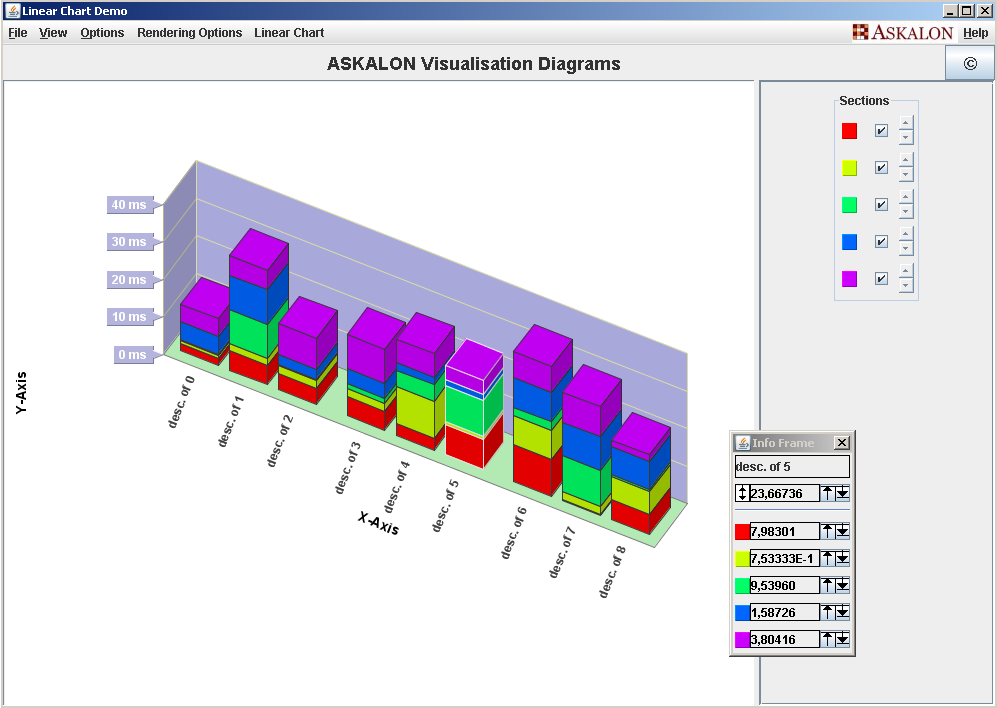
The LinearChart arranges cuboids in multiple sections, grouping may change between combined (stacked one on the other), vertical (one behind the other)
and horizontal (one next to the other). The number of sections is fixed, the number of entities may change over time.
There are four different factory methods available (via ChartFactory) for this chart:
public LinearChart getLinearChart(int numSections, int grouping) throws ChartNotAvailableException; public LinearChart getLinearChart(int numSections, int grouping, InputStream is) throws ChartNotAvailableException; |
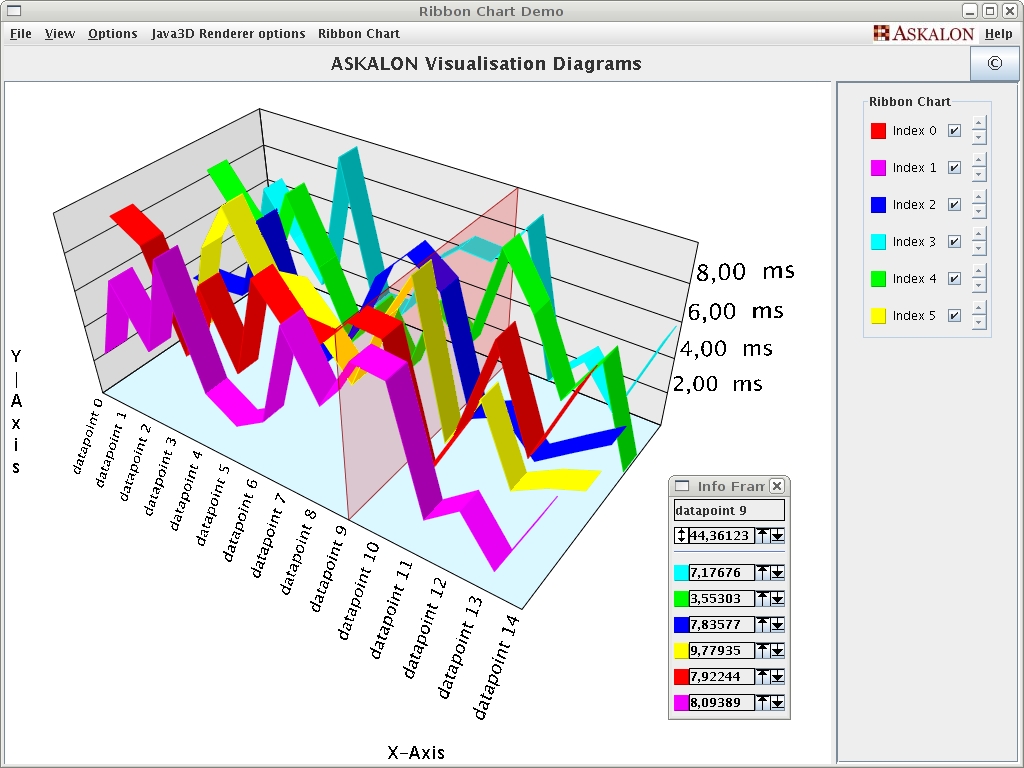
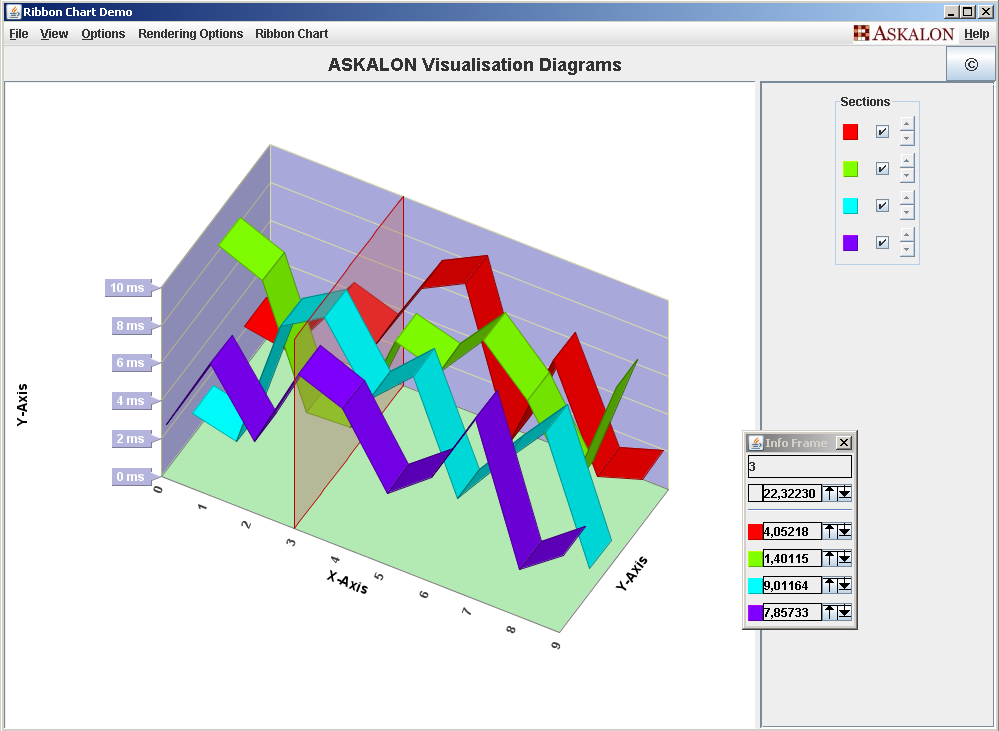
The RibbonChart arranges multiple ribbons with an arbitrary number of datapoints in a coordinategrid. The distance between datapoints has to be known when creating the chart,
but the distances may vary.
There are eight different factory methods available (via ChartFactory) for this chart:
public RibbonChart getRibbonChart(int numDataPoints) throws ChartNotAvailableException; public RibbonChart getRibbonChart(int numDataPoints, InputStream xml) throws ChartNotAvailableException; public RibbonChart getRibbonChart(double datapointPositions[]) throws ChartNotAvailableException; public RibbonChart getRibbonChart(double datapointPositions[], InputStream xml) throws ChartNotAvailableException; |

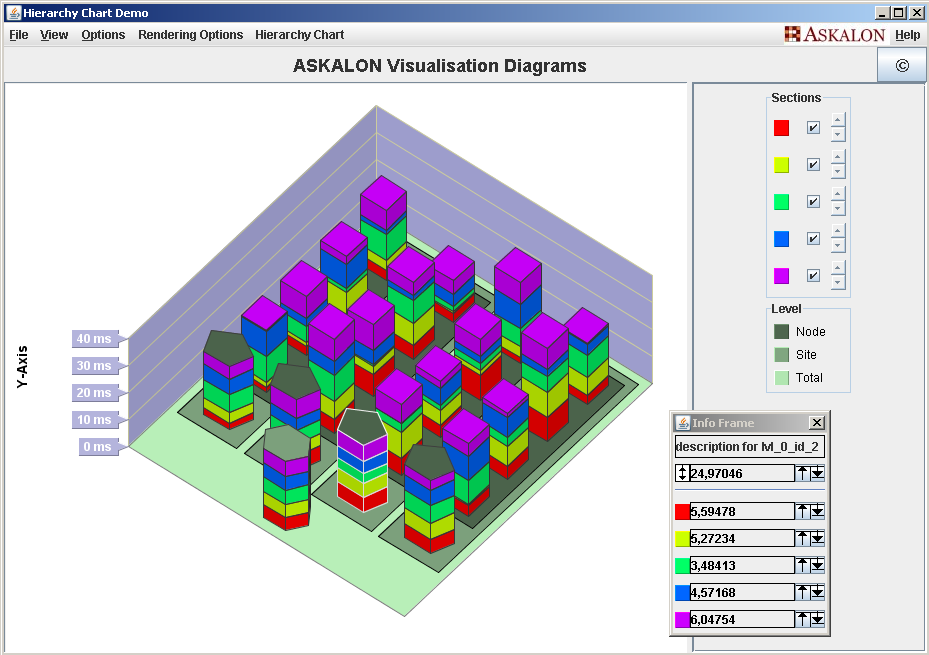
The HierarchyChart displays a tree based hierarchy of data cuboids (similar to LinearChart). Only the leaves of the tree are directly
assigned to values, the next level of entities displays a mean value (one of arithmetic, geometric, harmonic or quadratic) of the entities "behind" them. The mean value
formula can change at any time.
There are two different factory methods available (via ChartFactory) for this chart:
public HierarchyChart getHierarchyChart(int numSections, int levelCount, int showingLevel) throws ChartNotAvailableException; public HierarchyChart getHierarchyChart(int numSections, int levelCount, int showingLevel, InputStream xml) throws ChartNotAvailableException; |
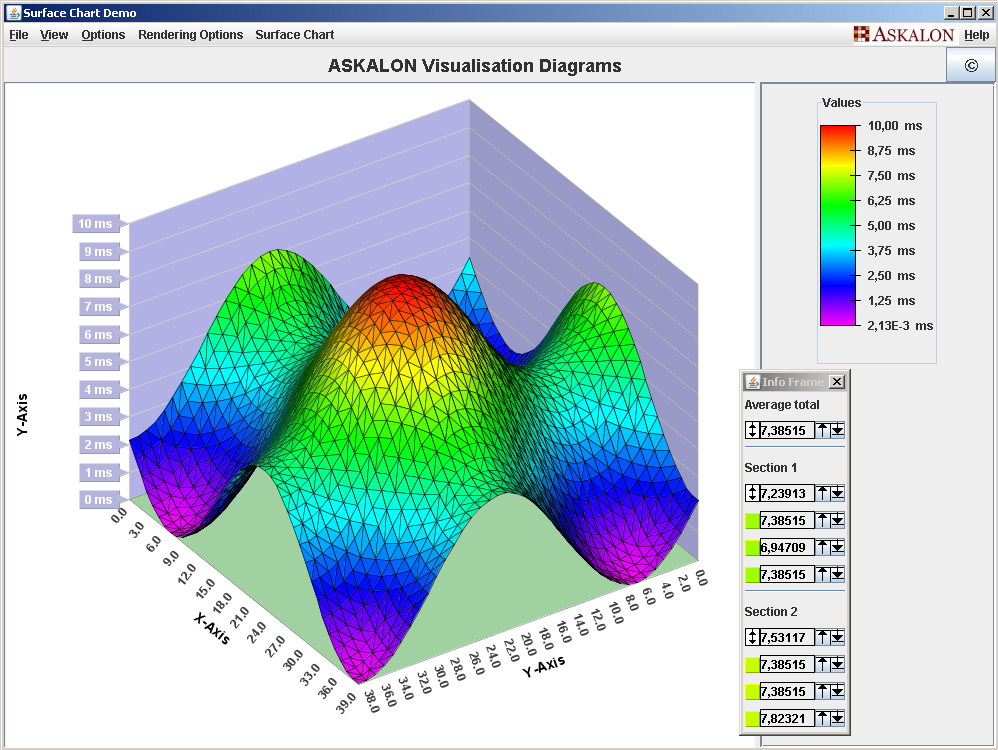
The SurfaceChart displays multiple values in a "grid" like datastructure. Compared to the MultipleSurfaceChart the SurfaceChart changes
the color of the grid depending on the values.
There are four different factory methods available (via ChartFactory) for this chart:
public SurfaceChart getSurfaceChart(int numDatapointsX, int numDatapointsZ) throws ChartNotAvailableException; public SurfaceChart getSurfaceChart(double[] valuesX, double[] valuesZ) throws ChartNotAvailableException; public SurfaceChart getSurfaceChart(double[] valuesX, double[] valuesZ, InputStream xml) throws ChartNotAvailableException; public SurfaceChart getSurfaceChart(int numDatapointsX, int numDatapointsZ, InputStream xml) throws ChartNotAvailableException; |


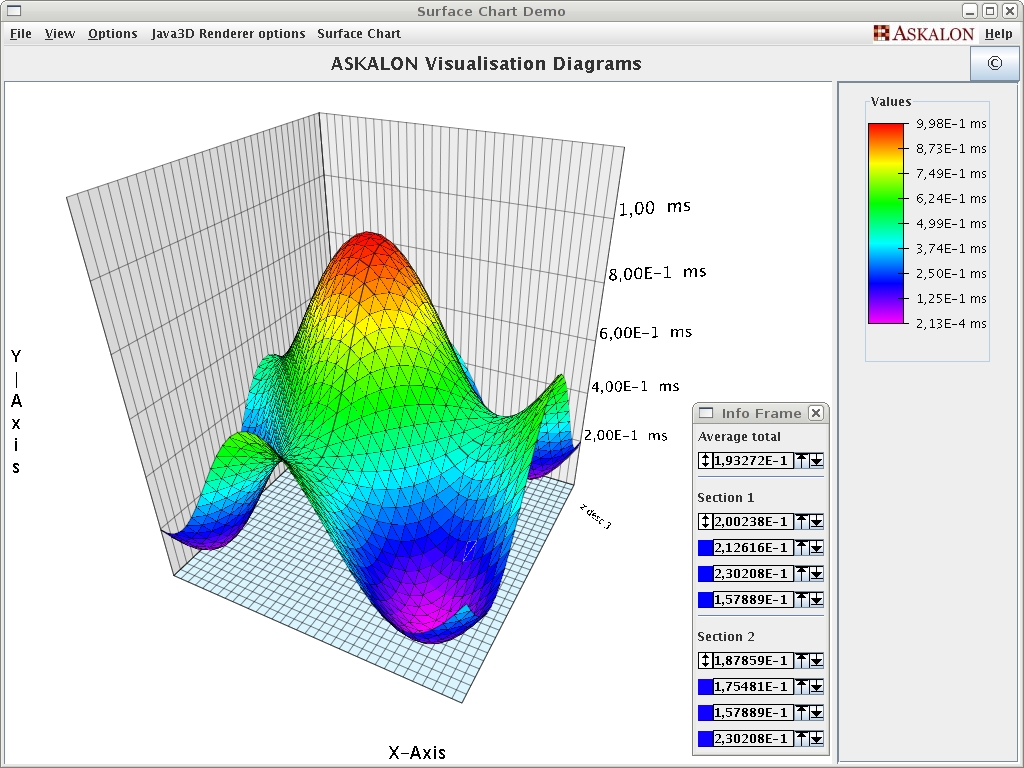
The MultipleSurfaceChart displays multiple values in multiple "grid" like datastructure. Compared to the SurfaceChart the MultipleSurfaceChart
does not change its color depending on the value, each section has its own color.
There are four different factory methods available (via ChartFactory) for this chart:
public MultipleSurfaceChart getMultipleSurfaceChart(int numDatapointsX, int numDatapointsZ) throws ChartNotAvailableException; public MultipleSurfaceChart getMultipleSurfaceChart(double[] valuesX, double[] valuesZ) throws ChartNotAvailableException; public MultipleSurfaceChart getMultipleSurfaceChart(double[] valuesX, double[] valuesZ, InputStream xml) throws ChartNotAvailableException; public MultipleSurfaceChart getMultipleSurfaceChart(int numDatapointsX, int numDatapointsZ, InputStream xml) throws ChartNotAvailableException; |
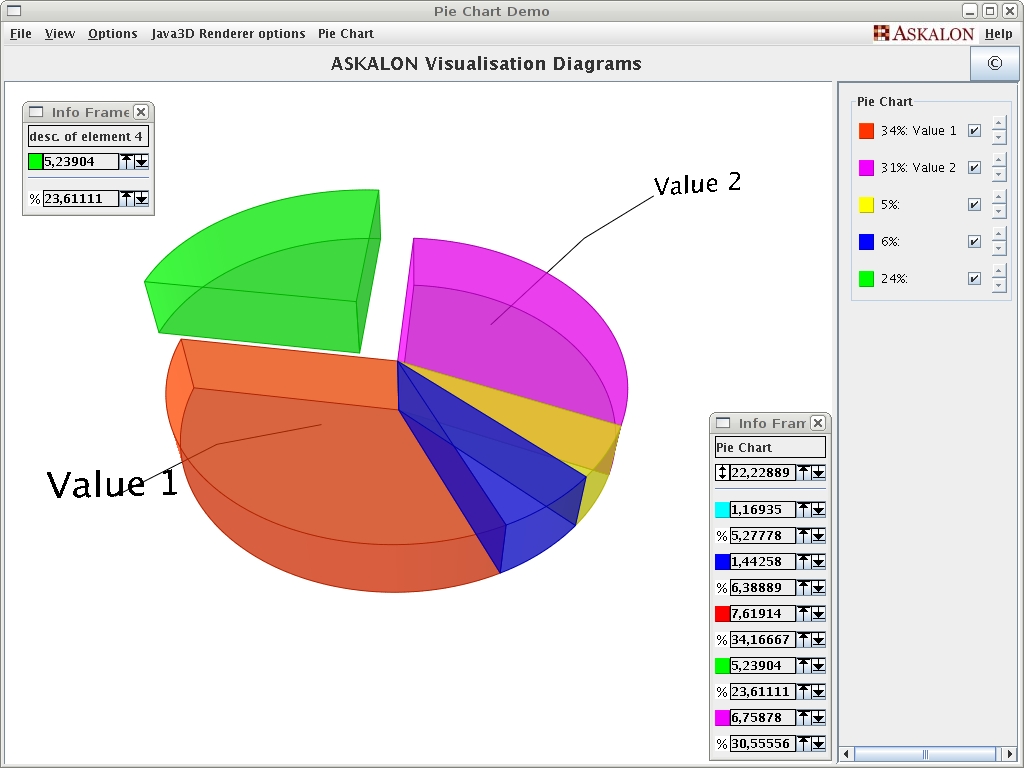
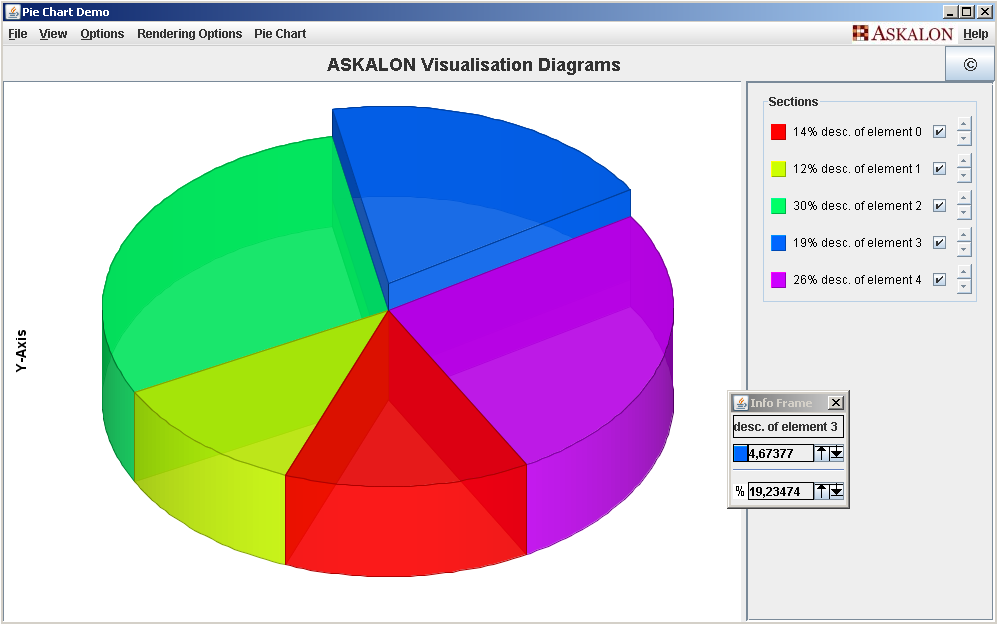
In the Pie Chart each pie piece represents the normalized value of the section. Sections may be reordered or hidden.
There are two different factory methods available (via ChartFactory) for this chart:
public PieChart getPieChart() throws ChartNotAvailableException; public PieChart getPieChart(InputStream is) throws ChartNotAvailableException; |
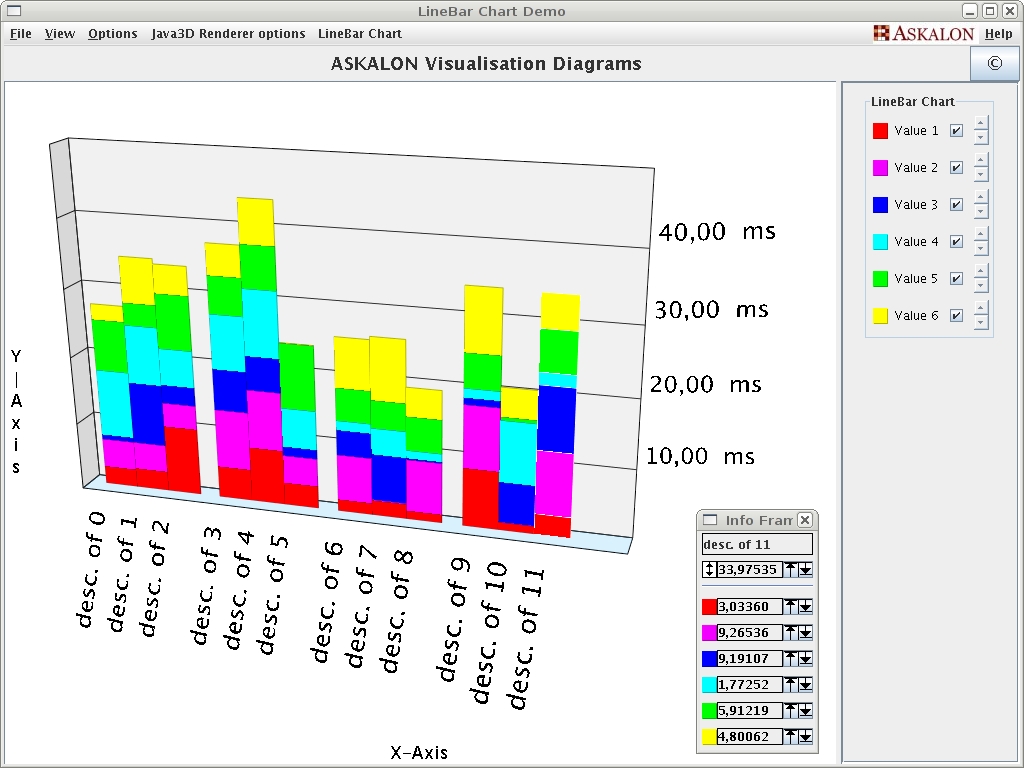
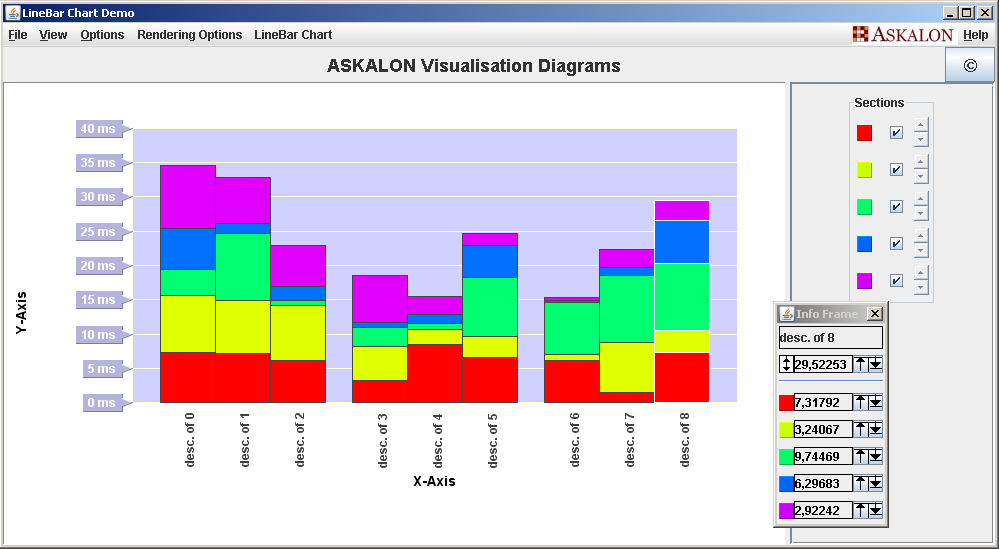
The LineBarChart is a reduced version of the LinearChart. The entities are next to each other without any additional space (besides groups), changing grouping between
combined, vertical and horizontal is not possible.
There are four different factory methods available (via ChartFactory) for this chart:
public LineBarChart getLineBarChart(int numSections, int grouping) throws ChartNotAvailableException; public LineBarChart getLineBarChart(int numSections, int grouping, InputStream is) throws ChartNotAvailableException; |
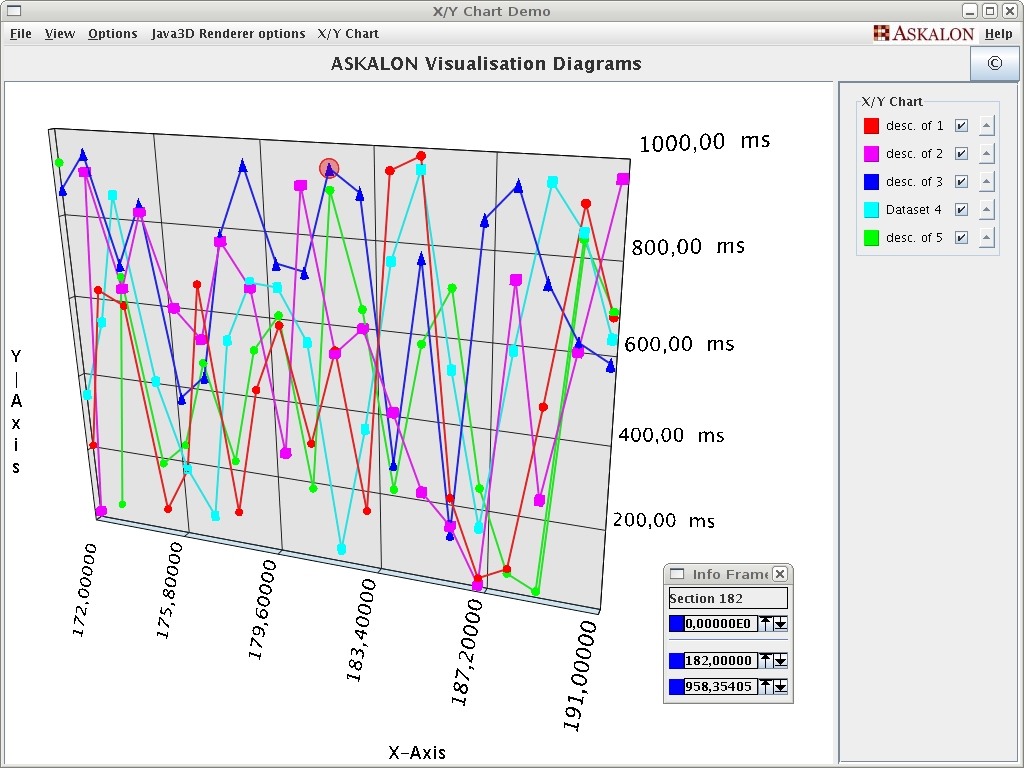
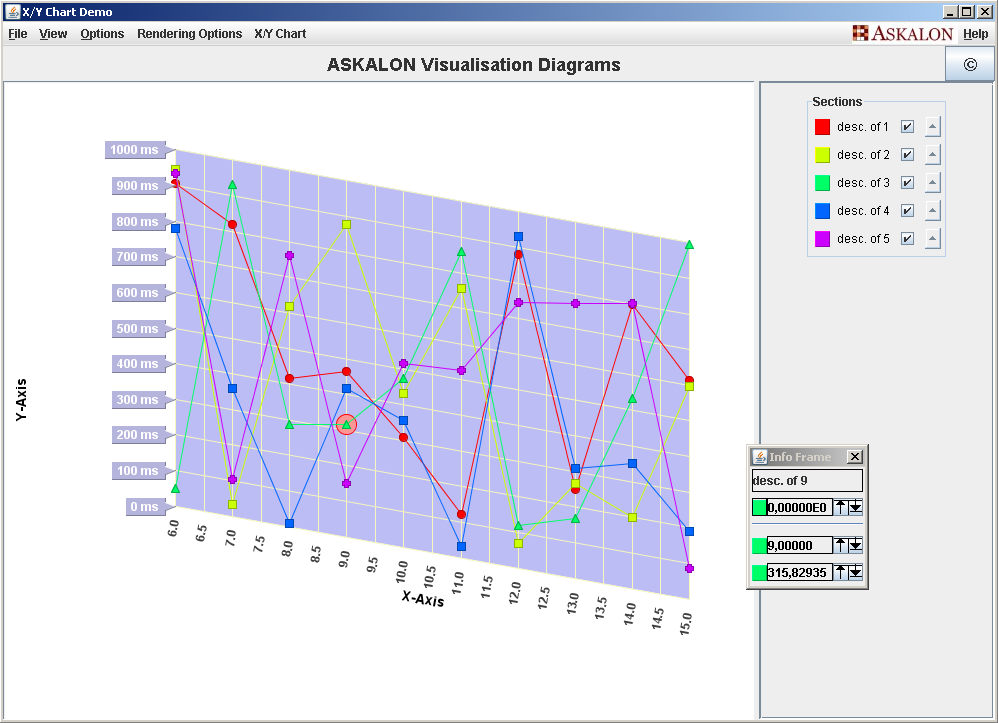
In the X/Y Chart any x-y value pairs can be represented. The values of both axes are real numbers. Links and nodes may be hidden.
There are two different factory methods available (via ChartFactory) for this chart:
public XYChart getXYChart(int max) throws ChartNotAvailableException; public XYChart getXYChart(int max, InputStream is) throws ChartNotAvailableException; |
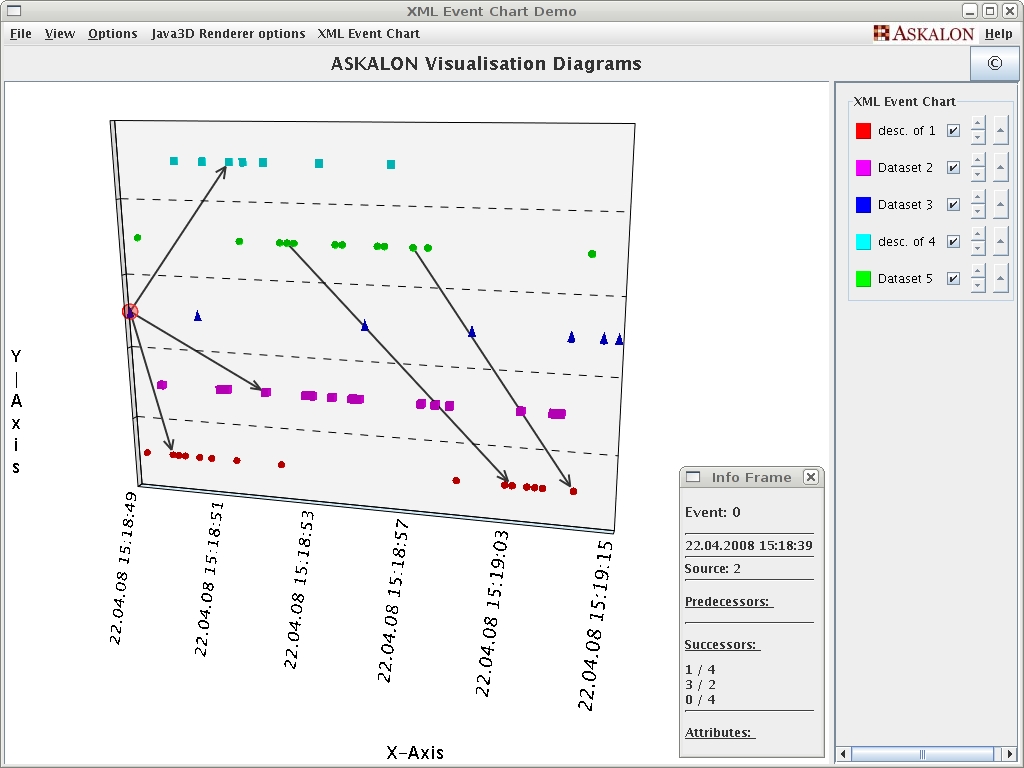

The XML Event Chart is quite similar to the X/Y Chart, but the X-axis represents timestamps, not any values as in the X/Y Chart.
There are two different factory methods available (via ChartFactory) for this chart:
public XMLEventChart getXMLEventChart(int max) throws ChartNotAvailableException; public XMLEventChart getXMLEventChart(int max, InputStream is) throws ChartNotAvailableException; |