
Visualization Diagrams
|
The Askalon Visualization Diagrams have been developed within
the framework of the
ASKLALON tool-set for cluster and grid computing. These diagrams are used by
the ASKALON tools to display performance and output data for single and
multi-experiment analysis. All of them are written in the
Java programming language. The package has
been developed under the supervision of
Prof. Thomas Fahringer. It consists of the following diagrams
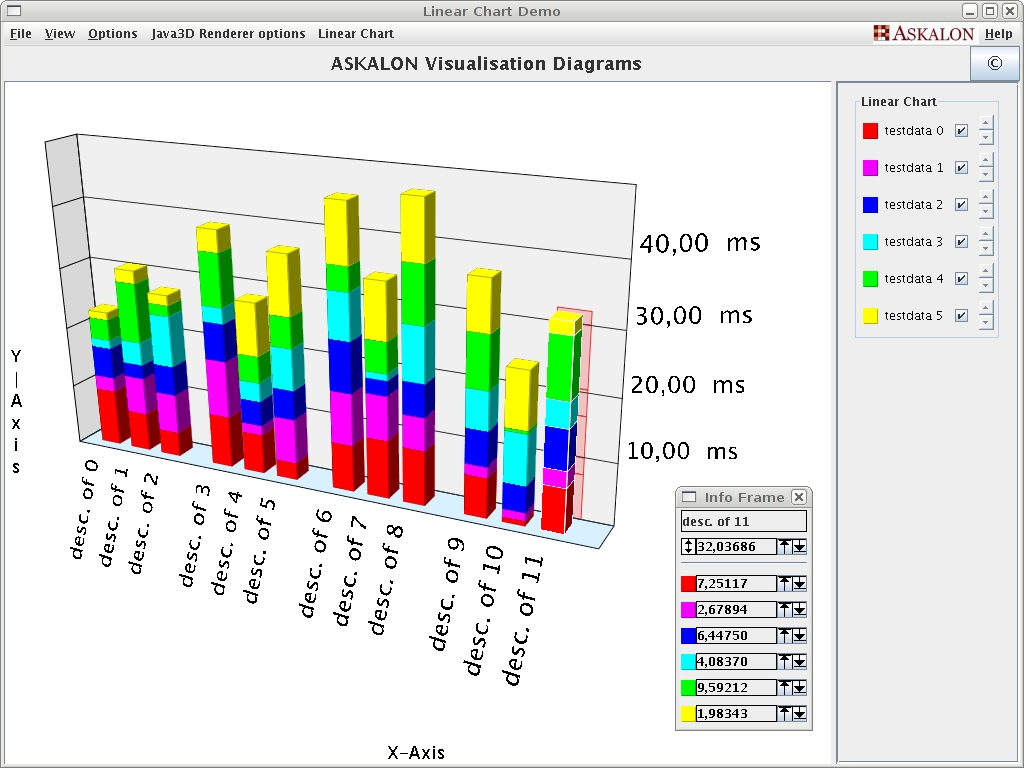
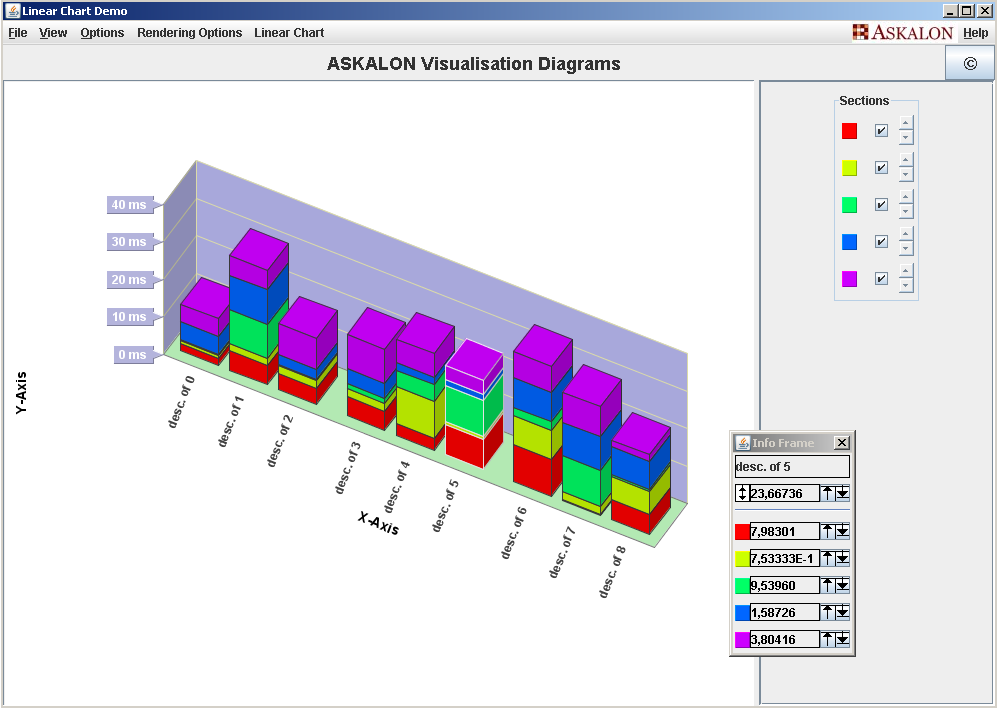
Linear Chart |
| The Linear Chart allows to display one line of stacked bars that can be grouped in several levels. The components of one bar can be arranged one on top of the other, side by side or one behind the other through the GUI. Besides components can be exchanged, hidden and normalized. This chart supports real 3D (rotating, sizing, perspective, ...) and dynamic change of data. The number of bars needs not to be known at start and may change. The exact values can be observed. Many more options are available. |
|
| Java3D implementation: Java applet, Java Webstart |
| Software rendered implementation: Java applet, Java Webstart |
| Documentation |
| API |
| Input data definition: DTD, XML |
| License: ASKALON |
| Licenses of third party libraries: TableLayout, Java Distribution License (JDL), BSD, JMF |
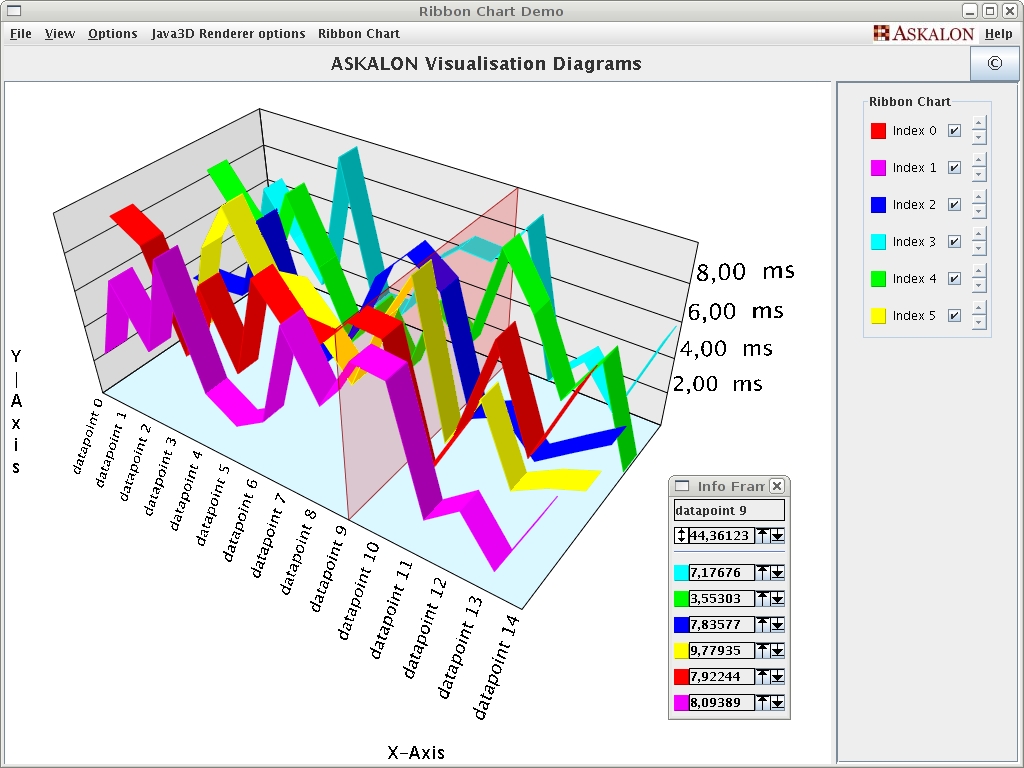
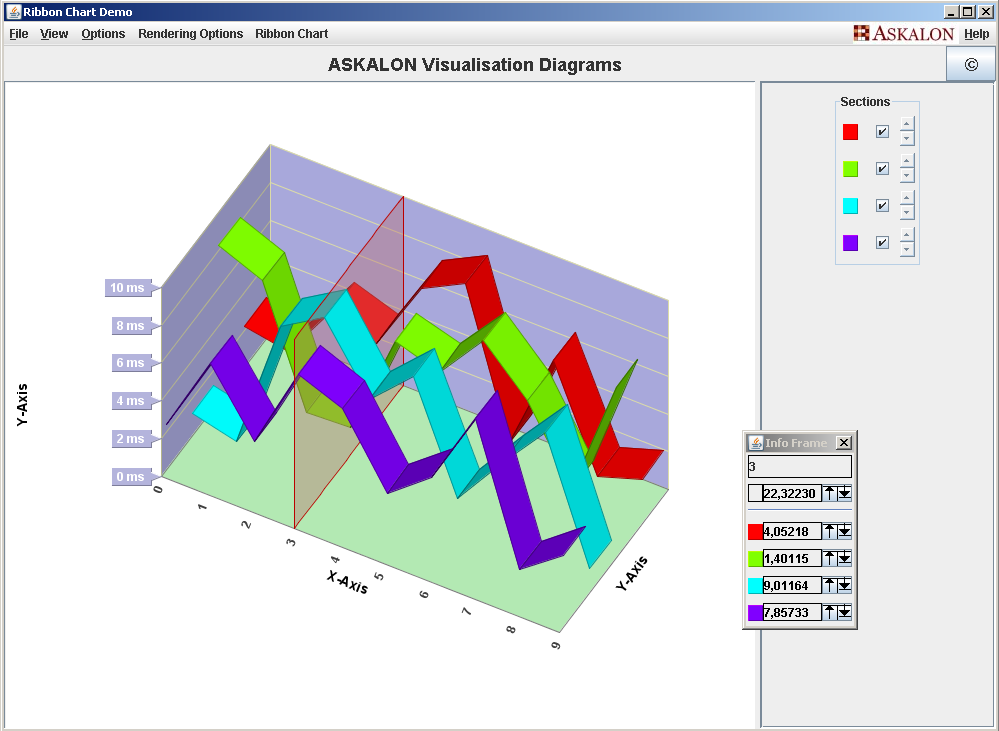
| The Ribbon Chart allows to display several courses of data as ribbons. The single ribbons can be accumulated, exchanged, hidden, normalized and transformed to solid "mountains" through the GUI. This chart supports real 3D (rotating, sizing, perspective, ...). The exact values can be observed. Many more options are available. |
|
| Java3D implementation: Java applet, Java Webstart |
| Software rendered implementation: Java applet, Java Webstart |
| Documentation |
| API |
| Input data definition: DTD, XML |
| License: ASKALON |
| Licenses of third party libraries: TableLayout, Java Distribution License (JDL), BSD, JMF |
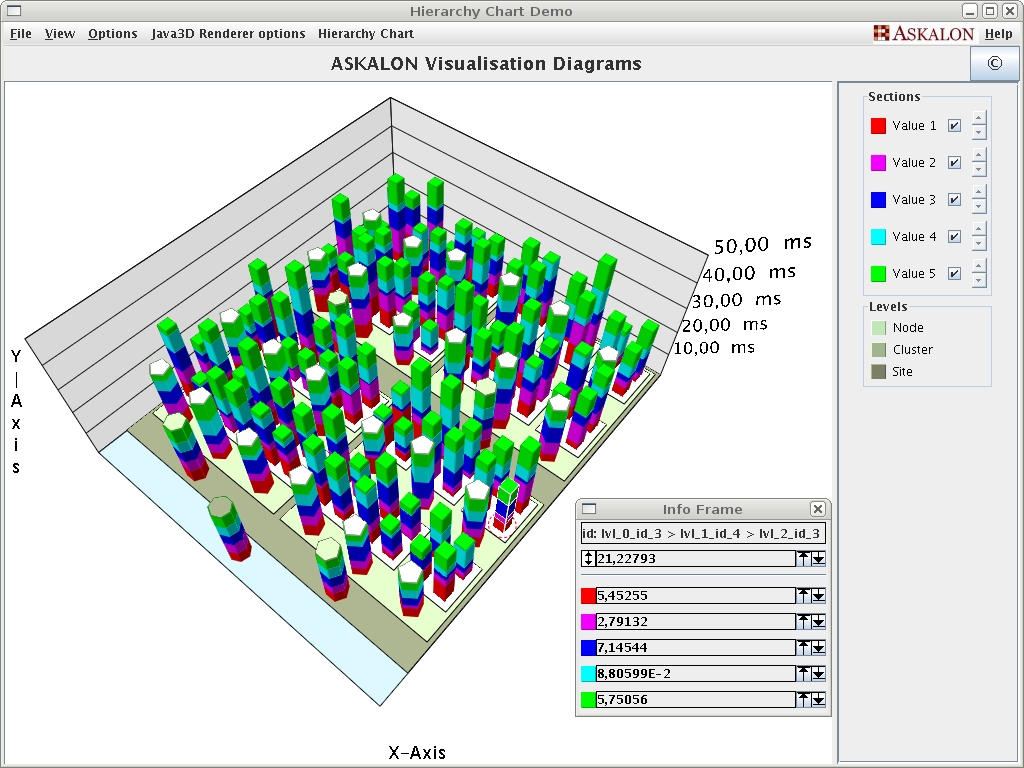
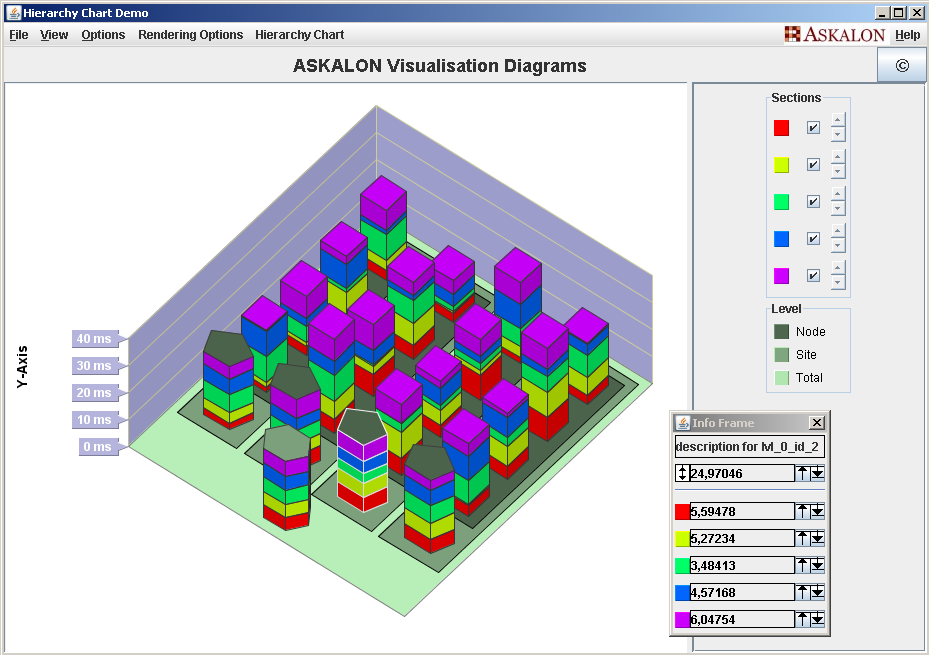
| The Hierarchy Chart is a very specialized chart to display data that is logically arranged in several levels of hierarchy. In other words the displayed values are the leaves of a tree with constant depth. The number of levels is unrestricted. The stucture can vary dynamically at runtime, nodes can be added and removed. The user can select the lowest visible level. This chart supports real 3D (rotating, sizing, perspective, ...) and dynamic change of data. The exact values at any level can be observed. Many more options are available. |
|
| Java3D implementation: Java applet, Java Webstart |
| Software rendered implementation: Java applet, Java Webstart |
| Documentation |
| API |
| Input data definition: DTD, XML |
| License: ASKALON |
| Licenses of third party libraries: TableLayout, Java Distribution License (JDL), BSD, JMF |
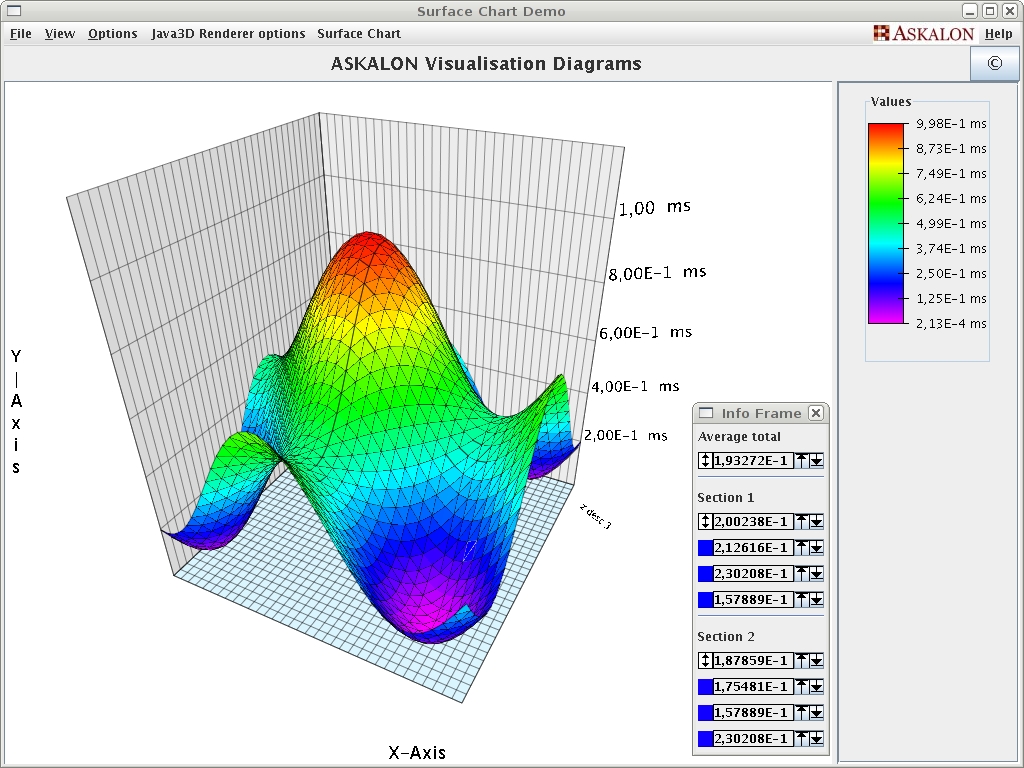
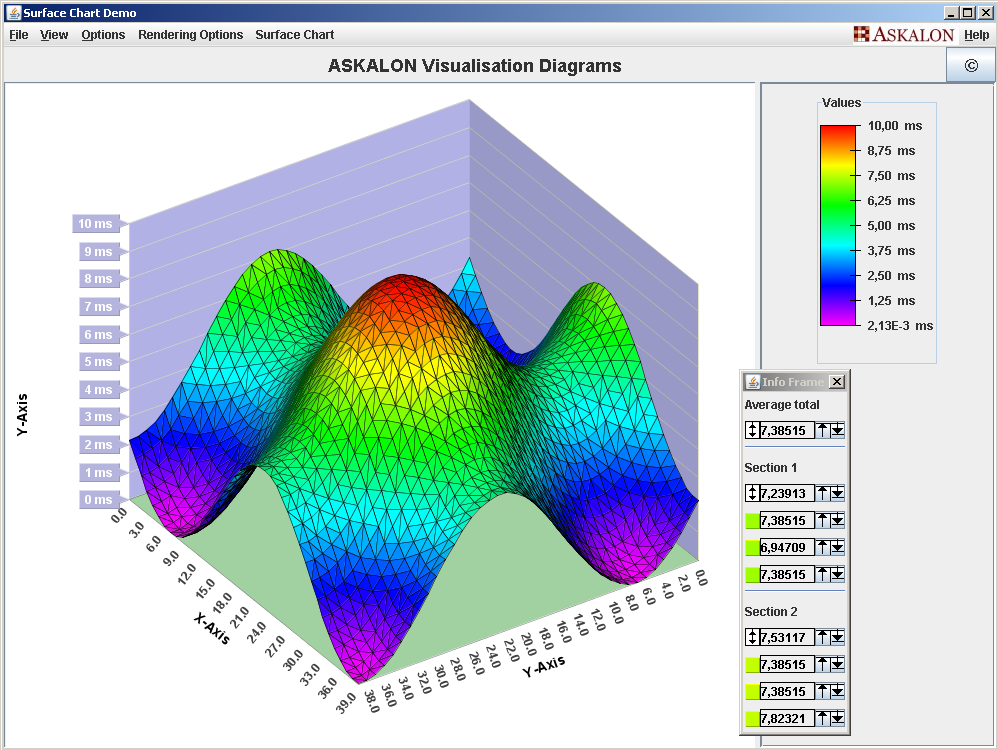
| The Surface Chart allows to display data that is distributed on a grid as a bended surface. The distances of the grid may vary. This chart supports real 3D (rotating, sizing, ...) and dynamic change of data. Besides that, the color of each element changes with its height. The exact values can be observed. Many more options are available. |
|
| Java3D implementation: Java applet, Java Webstart |
| Software rendered implementation: Java applet, Java Webstart |
| Documentation |
| API |
| Input data definition: DTD, XML |
| License: ASKALON |
| Licenses of third party libraries: TableLayout, Java Distribution License (JDL), BSD, JMF |
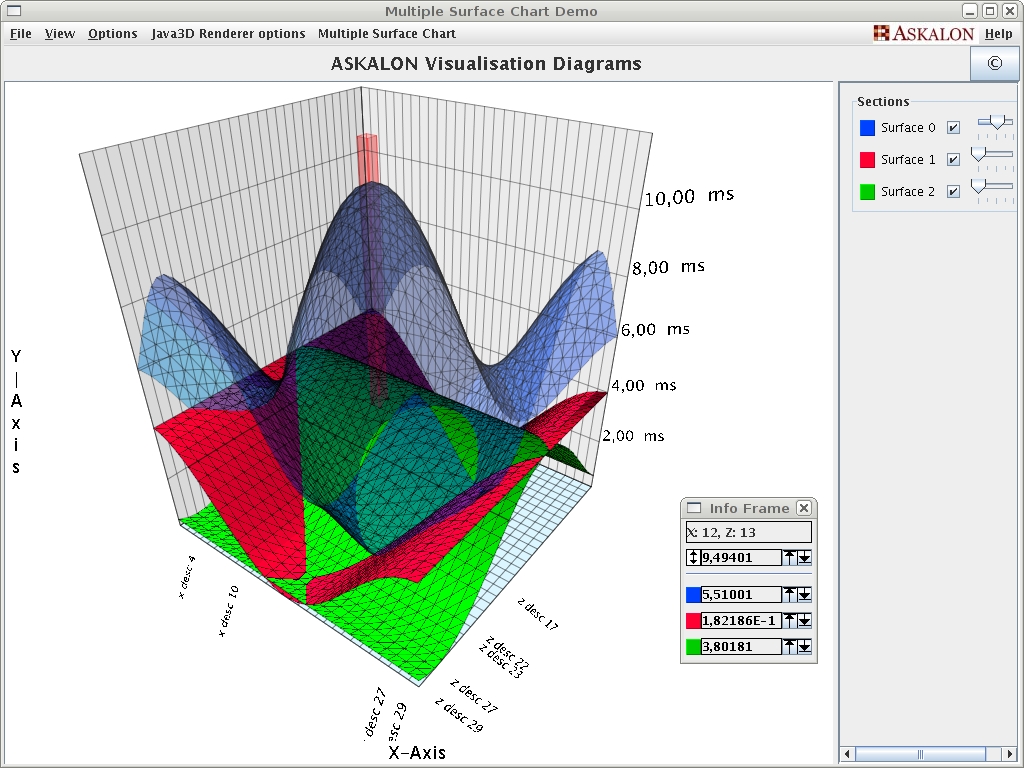
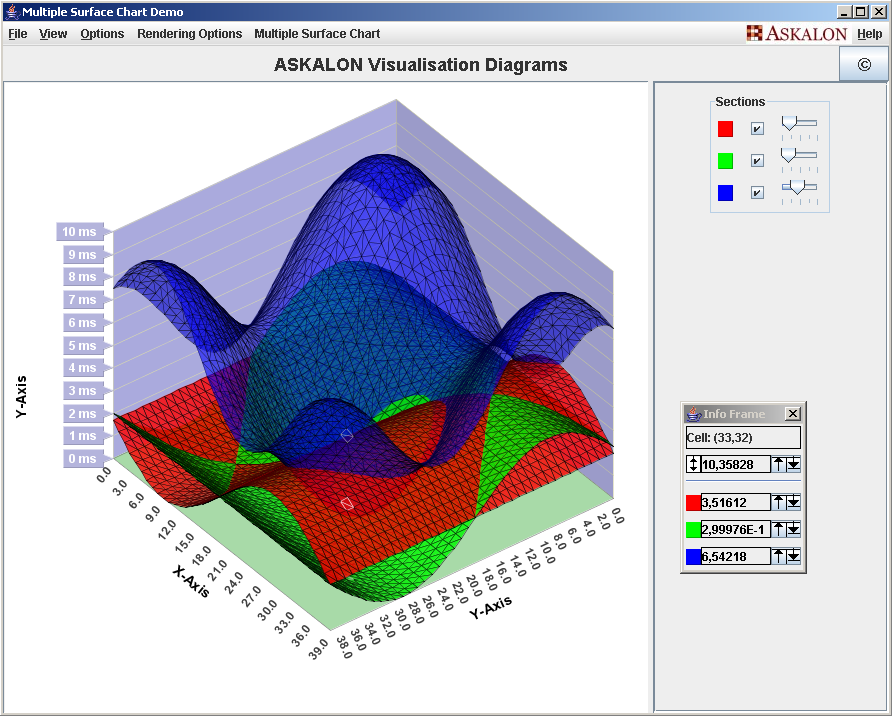
| The Multiple Surface Chart is similar to the Surface Chart, but it can display multiple surfaces. The distances of the grid may vary. This chart supports real 3D (rotating, sizing, ...) and dynamic change of data. Colors do not vary on value changes, each surface can be made transparent. The exact values can be observed. Many more options are available. |
|
| Java3D implementation: Java applet, Java Webstart |
| Software rendered implementation: Java applet, Java Webstart |
| Documentation |
| API |
| Input data definition: DTD, XML |
| License: ASKALON |
| Licenses of third party libraries: TableLayout, Java Distribution License (JDL), BSD, JMF |
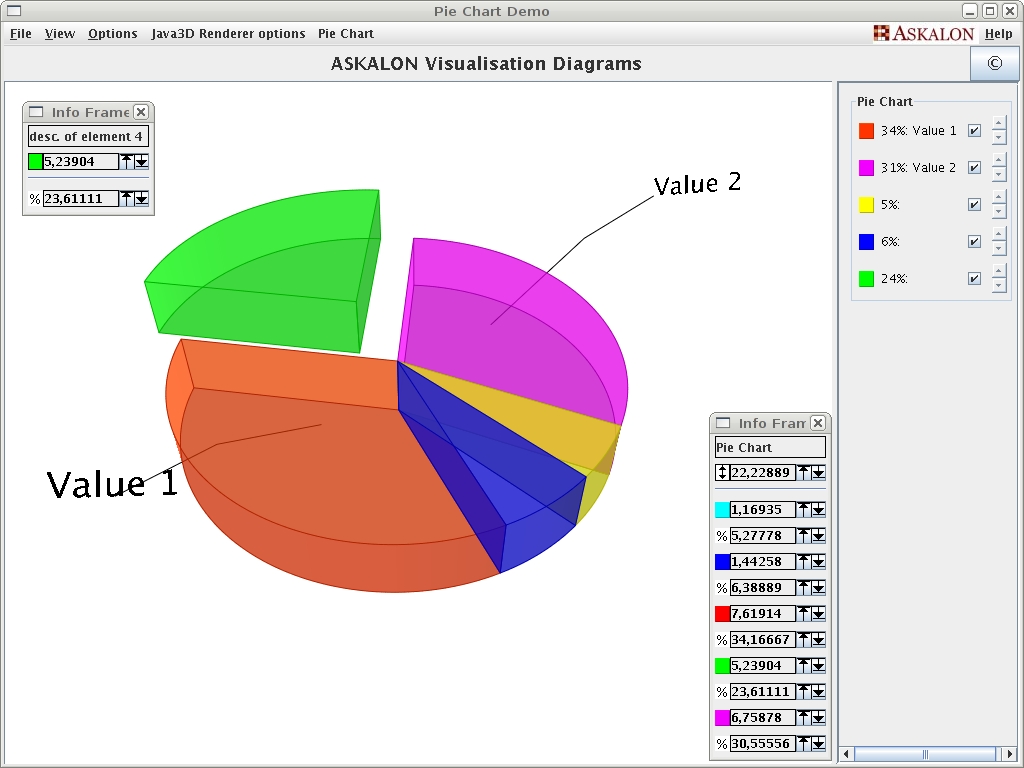
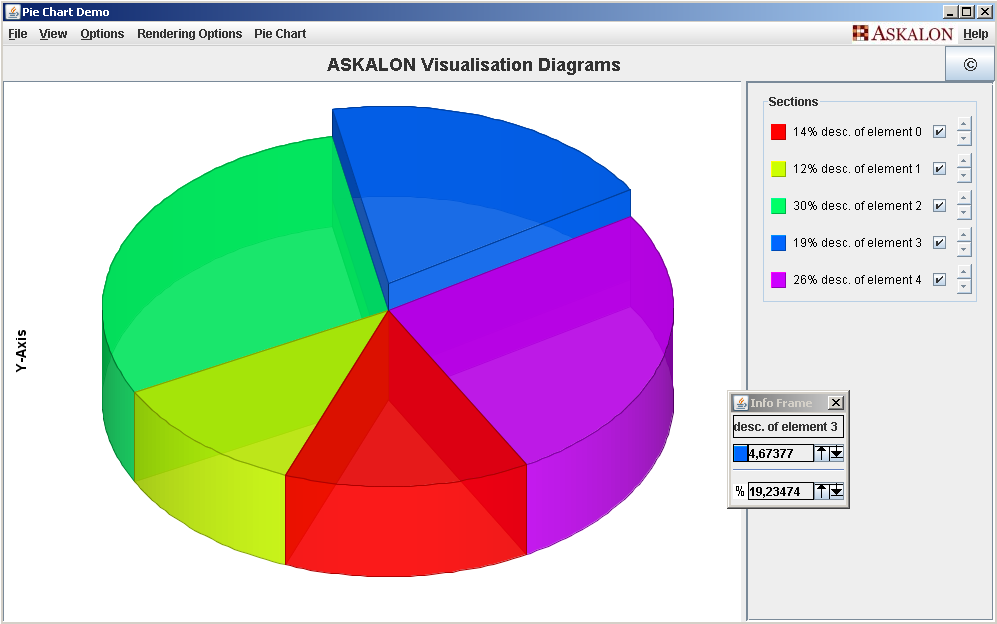
| The Pie Chart is a standard PieChart. This chart supports real 3D (rotating, sizing, ...) and dynamic change of data. The exact values can be observed. Many more options are available. |
|
| Java3D implementation: Java applet, Java Webstart |
| Software rendered implementation: Java applet, Java Webstart |
| Documentation |
| API |
| Input data definition: DTD, XML |
| License: ASKALON |
| Licenses of third party libraries: TableLayout, Java Distribution License (JDL), BSD, JMF |
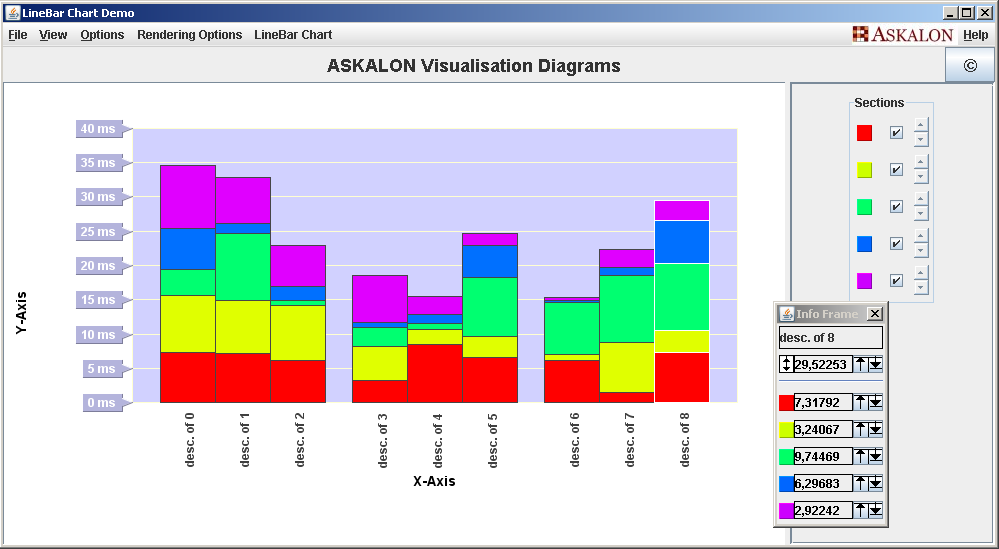
| The Line/Bar Chart is more or less a restricted version of the Linear Chart. It has all the characteristics of a normal Linear Chart but misses grouping. This chart supports real 3D (rotating, sizing, ...) and dynamic change of data. |

|
| Java3D implementation: Java applet, Java Webstart |
| Software rendered implementation: Java applet, Java Webstart |
| Documentation |
| API |
| Input data definition: DTD, XML |
| License: ASKALON |
| Licenses of third party libraries: TableLayout, Java Distribution License (JDL), BSD, JMF |
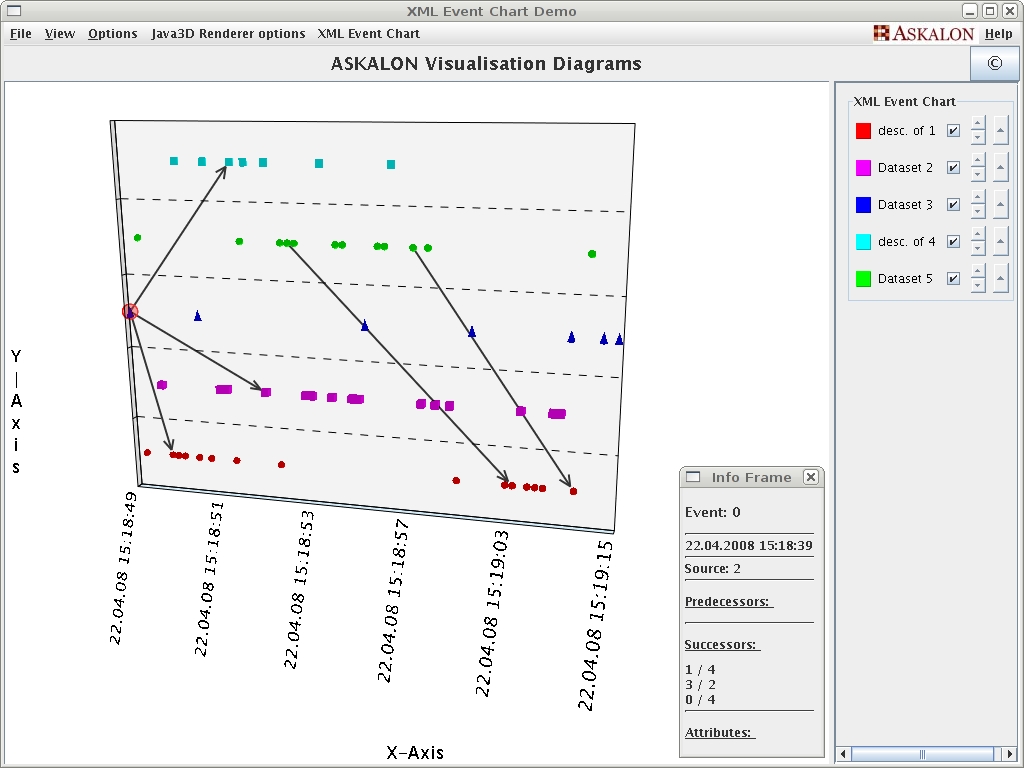
| In this chart the Y-axis represents objects/entities that generate events and the X-axis stands for the time at which an event is generated. If events are connected to each other this is indicated by a connecting line. |

|
| Java3D implementation: Java applet, Java Webstart |
| Software rendered implementation: Java applet, Java Webstart |
| Documentation |
| API |
| Input data definition: DTD, XML |
| License: ASKALON |
| Licenses of third party libraries: TableLayout, Java Distribution License (JDL), BSD, JMF |
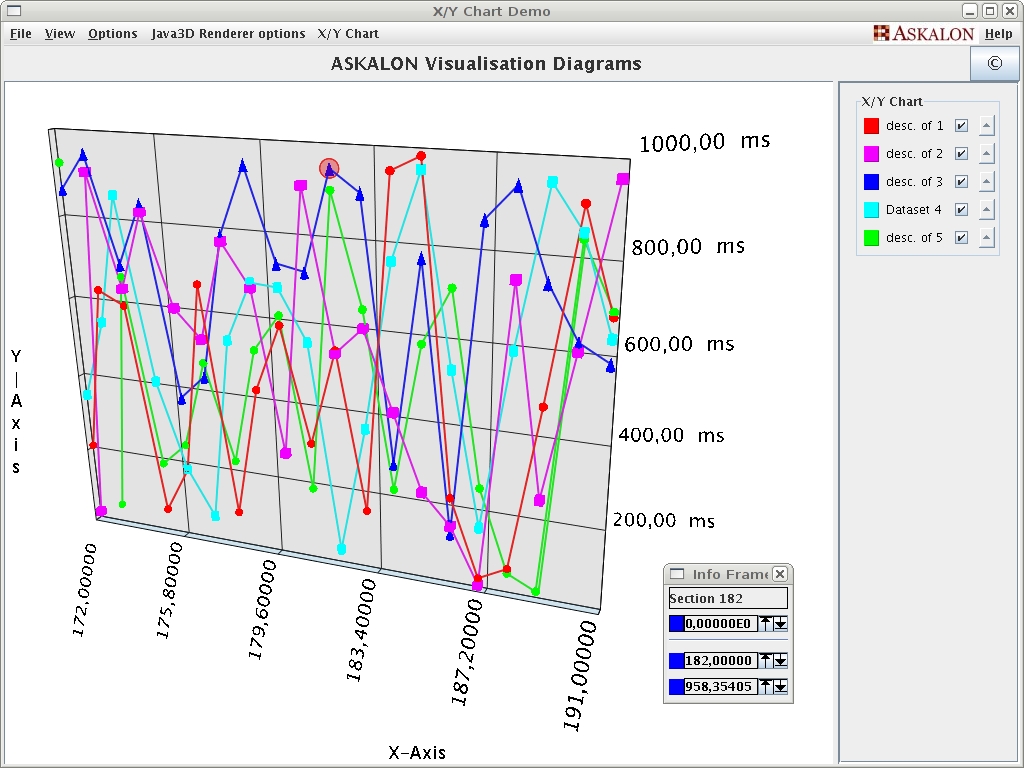
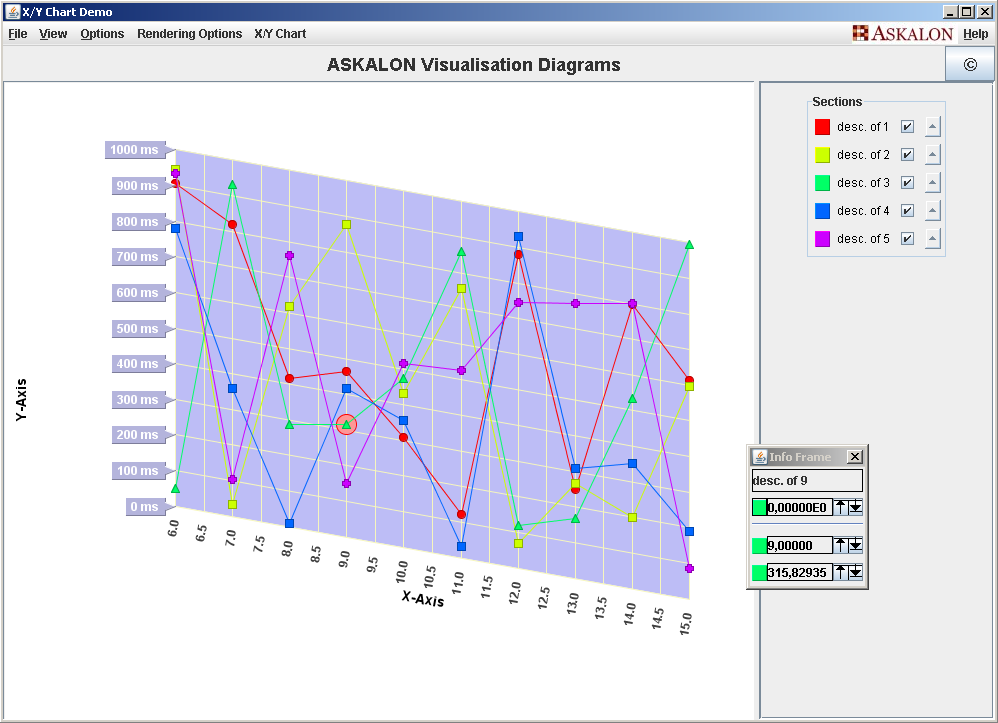
| This chart is a standard X/Y diagram where both axes represent real numbers. A diagram may contain several datasets (a sequence of data points), and data points from one dataset can be linked to their predecessors/successors with lines. |
|
| Java3D implementation: Java applet, Java Webstart |
| Software rendered implementation: Java applet, Java Webstart |
| Documentation |
| API |
| Input data definition: DTD, XML |
| License: ASKALON |
| Licenses of third party libraries: TableLayout, Java Distribution License (JDL), BSD, JMF |